
For video explanations see the videos here.
How do I create a Project?
Only Professional (Admin) users can create projects.
- Click the ‘Projects’ folder in the upper left corner of AO.
- Click +Add Project in the upper right corner of the Projects window.
- Fill out the fields on the details page and click "Save & Continue". Click "OK".
- Details entered into the Name, Description, Platform Type, Sensor Type, and Data Source will be searchable.
- Latitude & Longitude must be defined in decimal degrees. If not specified on Project creation, they will be updated based on the first file visualized in that Project.
- You will be taken to the Groups Access tab where you can manage groups that have access to this project. It is not mandatory to assign a Group to a project. To add a Group, select them from the Organization's Groups list on the right and click the left arrow to add them to the Assigned Groups on the left.
- If you add Groups, click "Save & Exit". If you don't want to add Group access, click "Cancel" or hit the "X" in the upper right.
Project Access
How do I control access to a project?
To manage access to a project, you need to add a project to a Group and make sure the user(s) you want to share the data with are in that Group.
See detailed instructions here.
How do I remove access to a project?
You can remove access to a project by removing a user from a Group who has access to that project. Alternatively, edit the Project Groups and remove a Group to remove access for all members of that Group.
See detailed instructions here.
How do I upload data to a Project?
Professional (Admin) users and Users can upload data to a project.
Also, see the Upload & Visualize Your Data video here.
- Click the ‘Projects’ folder in the upper left corner of AO.
- (optional) Use the search feature to find the project you'd like to add data to.
- Once you find the project to which you'd like to upload data, click the
 icon in the View/Edit column.
 - Once you're on the View Project page, click the Files tab.
- Click "Upload File" to open the Upload window.
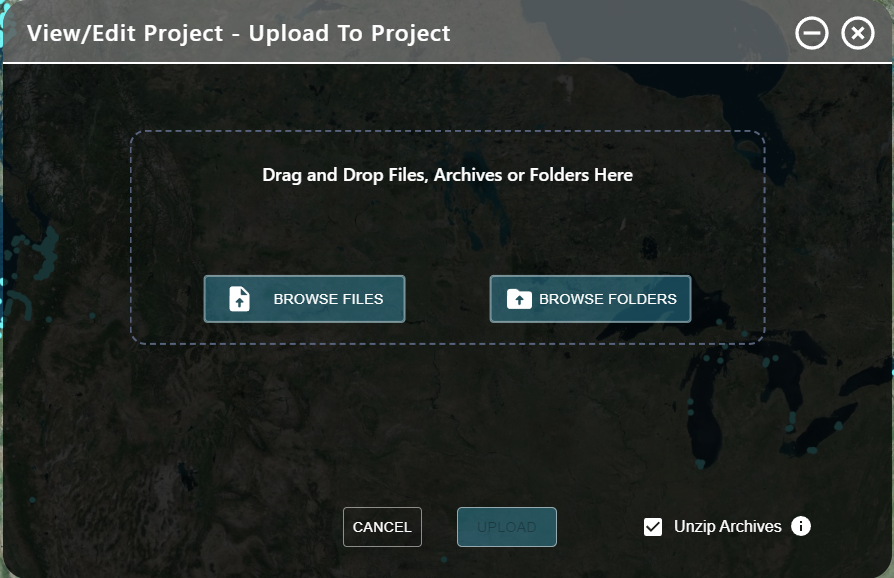
- You can drag and drop files (including archive files) and folders into the region outlined by a dotted line
- Click the "BROWSE FILES" button to choose individual files to upload, or "BROWSE FOLDERS" to choose a folder to upload
- By default, any archive files (ZIP, RAR etc) are extracted automatically after upload. Disable the "Unzip Archives" option to disable this automatic functionality.
- Note
- When choosing individual files to upload they will always be uploaded to the root folder of the Project
- When choosing a folder to upload, the folder and all structure and contents will be maintained in AO after upload
- To update the contents of a folder at a later date, the same root folder must be selected for upload to maintain the folder structure.
- When all files/folders are selected, click "UPLOAD" to begin the transfer.
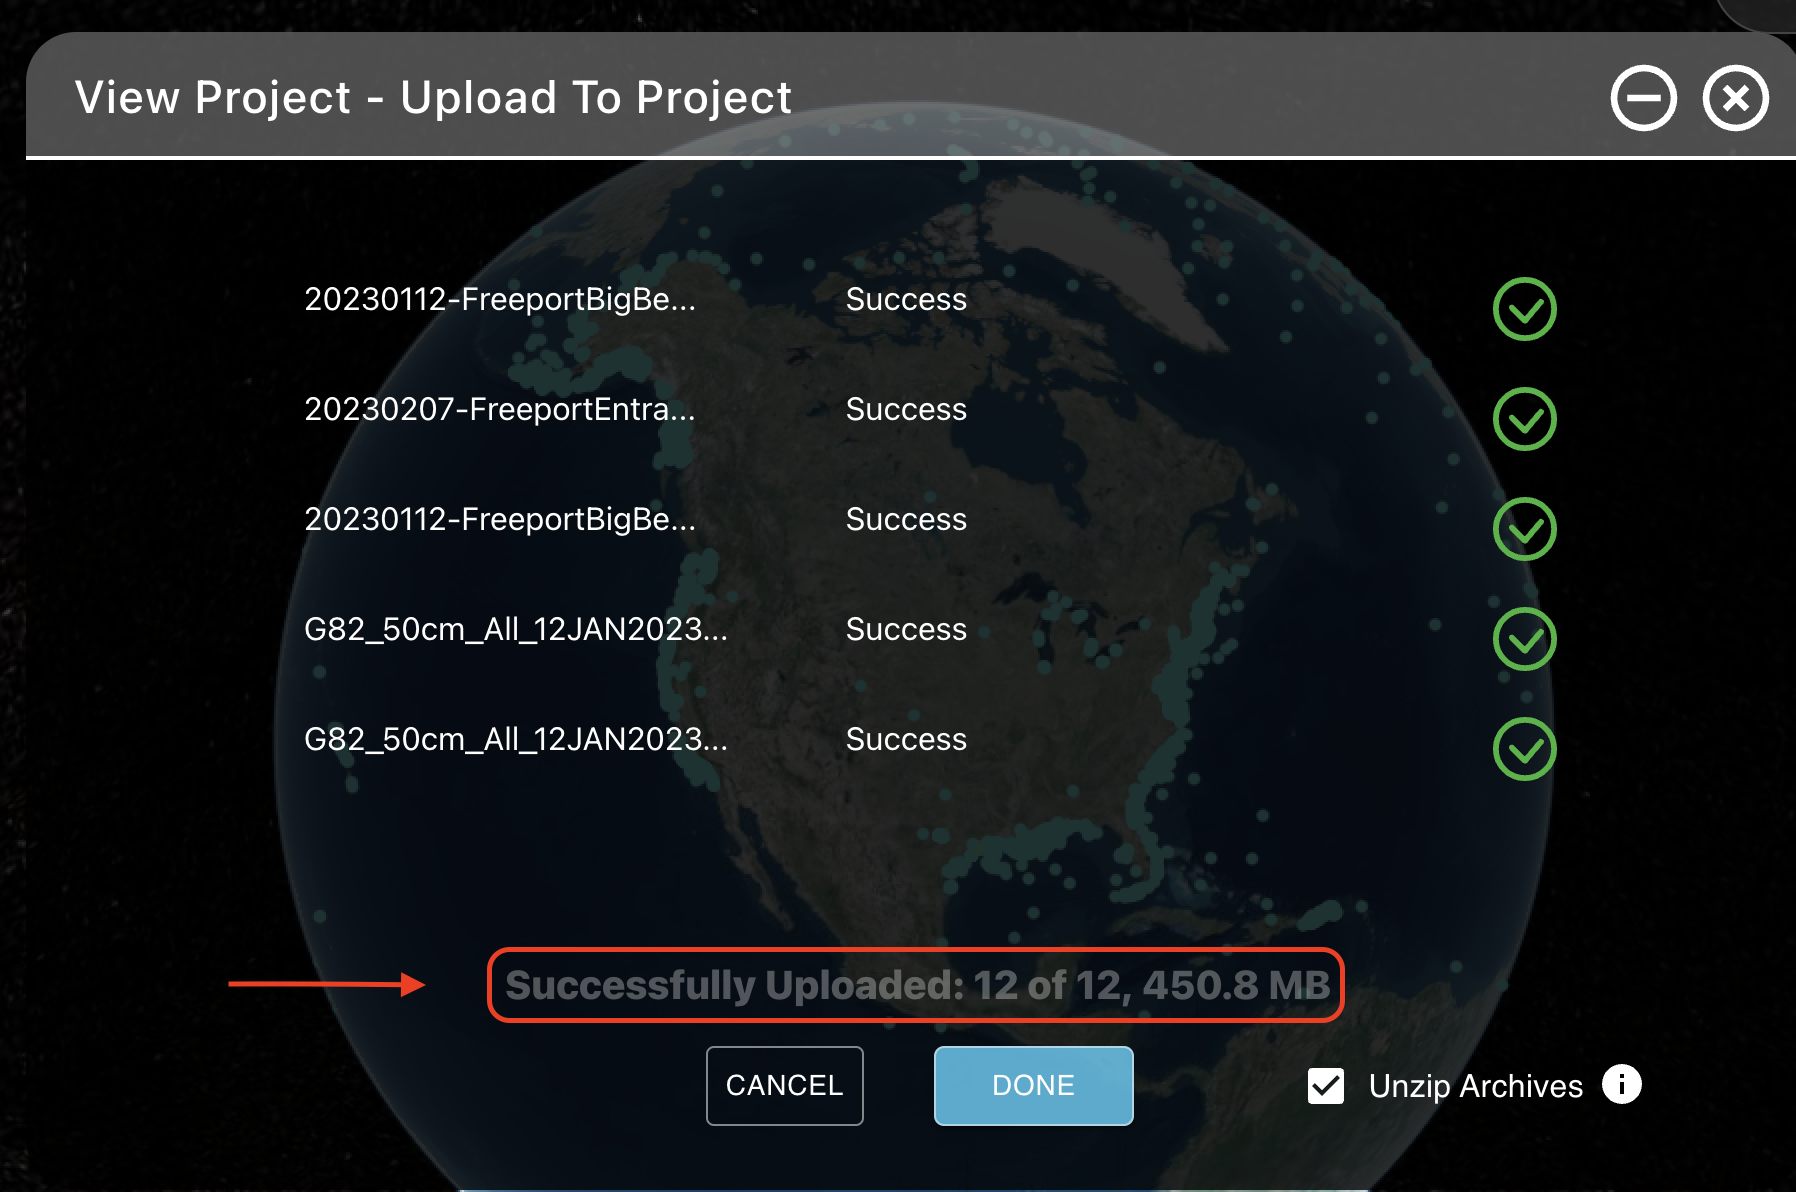
- The window will display the upload progress for each selected file and/or folder contents. The overall progress will be displayed up to 100% across the bottom of the window. If you close the Upload window or the browser your upload will fail.
- Note if your upload includes archive files, and Unzip Archives is enabled, these files are extracted after the upload is complete. Depending on the size of the archive files this may take up to several hours, during which progress will stay at 100%. Do not click Cancel.
- When the upload is complete click "DONE" to return to the Files window.
Frequently Asked Upload Questions
Does AO prevent certain characters in paths or file names?
AO does not prevent any specific characters in paths or file names, other than those already prevented on most common file systems. If you encounter problems with a particular path or file name please contact us for assistance.
Is there a limit to the number of files when uploading?
No, we have seen uploads with thousands of files without issue. However, performance and speed may be impacted during the upload process depending on your own connectivity to the internet, which we unfortunately cannot control. Any partial uploads (i.e. your internet drops out during a transfer) will not appear in AO and can be uploaded again when your connection is restored.
Is there a limit size for files uploaded?
Yes, currently there is a limit of 10 GB per single file.
How do I visualize data?
See the Upload & Visualize Your Data video here.
As a prerequisite, your data must fit the requirements laid out in this article.
Once you have your data in a visualizable format and uploaded to a Project, go to the View Project page for that Project.
- Click the Files tab.
- Find the file that you would like to be visualized. Files are pre-scanned to determine if they are suitable to visualize, and if so the cloud icon
 will be available next to the file name. Click this button in the Visualize column.
 - The options visible on the Visualize File page will vary depending on the type of file that you are visualizing. Some of the common options are:
- Name - The name assigned to the resulting visualization, the default is the same as the file name. This must be a unique name and an error will be shown if a visualization with this name already exists.
- Data Type - For some file formats you must specify what type of data is in the file. Depending on the file contents scanned by AO, different options may or may not appear: "Bathymetry" may or may not appear as an option, generally "Side Scan" "Synthetic Aperture Sonar" "Magnetometer" and "Other" will always appear as options. Other options in this window will also change depending on the selection in this field.
- Coordinate Reference System - Choose the horizontal and vertical CRS as required. See Vertical and Horizontal Datum for more information.
- Color Map - This will be the Color Map assigned to the resulting visualization for display in AO. The default is "Jet" which is a rainbow gradient. For grid files which already have colors assigned, choose "Other" to keep the same color map.
- Z Convention (Bathymetry only) - The sign convention of the grid values, Positive Up (i.e. Heights) or Positive Down (i.e. Depths). Many grid file formats do no store this information.
- Vertical Range - By default AO will apply the color map automatically on a range between the minimum and maximum values found in the file and no input is required in this field. However, a file may contain outliners which result in poor coloring, or you may wish to match a visualization to the same range as other adjacent files; in this case you can manually enter a minimum and/or maximum value for application of the color map.
- NoData - (advanced) Some file formats contain a "NoData" value to mark empty cells which should not be colored, and AO will normally read this value automatically if it is stored correctly in the file. Only override this setting if your file is not being visualized correctly.
- After choosing the Options you would like to use, click "Generate Visualization".
- You will then be moved to the Visualizations tab. You can see the status of your rendering in the Status column, which refreshes every 60 seconds. Alternatively, click the reload icon
 to refresh the status immediately.
 - Once your visualization status is "Available", click the eye
 in the View column to be taken to the visualization.
 - Close or minimize the View Project window to view the visualization.