
Repeat condition surveys already hold the answers a dredging plan needs. With AO as it is today and two sample scripts, you can see where a channel is shallower than the depth you need, how much material is there, how fast it's coming back and when to act, with a backtest that shows how far to trust the forecast. The scripts run on your computer and put their results into an AO project, where operations, engineering and contractors review the same picture.
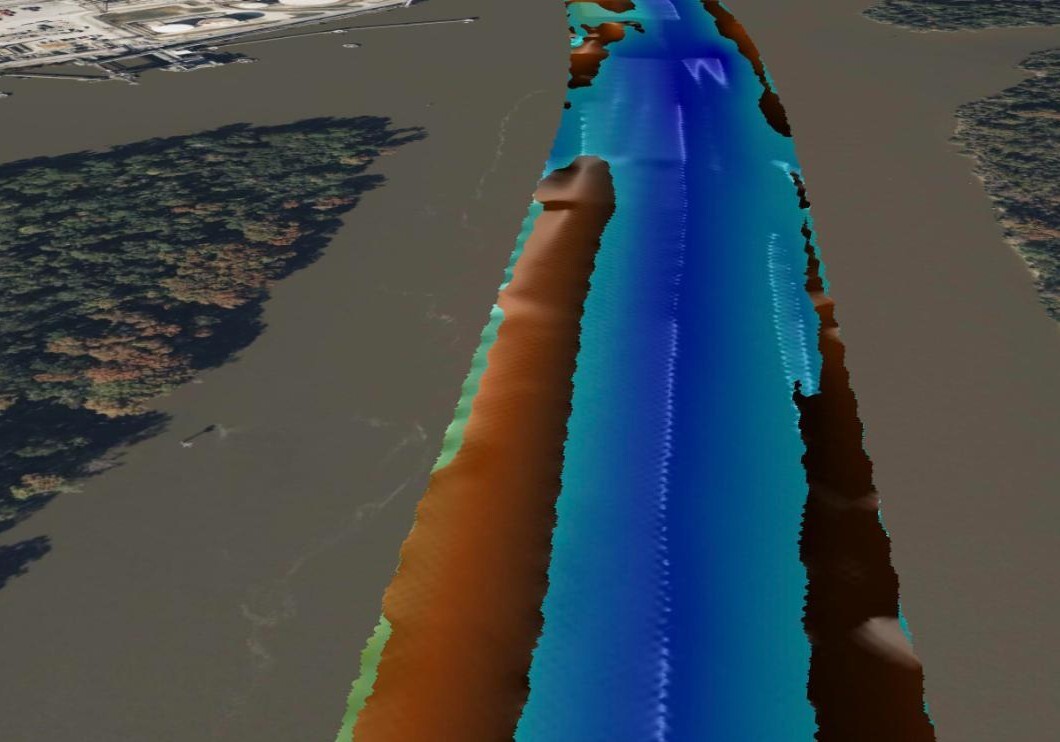
The Neches River near Beaumont, Texas: the U.S. Army Corps of Engineers' (USACE) survey of September 11, 2026 as a Grid in AO, and in gold the material the forecast puts above 40 ft by September 2028, at its forecast depth. Data: U.S. Army Corps of Engineers.
What you get
| Question | What you get | Where |
|---|---|---|
| Where is it too shallow? | Outlines of where the bottom is above the depth you need now, in 12 months and at the end of the forecast, and the material itself at its forecast depth | Shapes in AO, in red, orange and yellow, and a gold Grid |
| How much material? | Cubic yards above that depth, for each shoal and for every 1,000 ft of channel | The shoal's object in AO, and a table |
| How fast is it coming back? | Cubic yards a year since the shoal was last dredged | The shoal's object, and a chart |
| When do we act? | When the shoal will hold as much as it did before it was last dredged, with a range, and the date to start, given your lead time | The shoal's object, and a chart |
| Can we trust it? | A backtest: forecasts made from every past survey, checked against the surveys that came later | A table and a chart |
The example: the Neches River near Beaumont
The example uses 43 public USACE surveys, from 2016 to 2026, of the Neches River channel from Smiths Bluff to Beaumont, Texas: 8.5 miles at a maintained depth of 40 ft below mean lower low water (MLLW). USACE dredged its upstream end in August 2018, and stations 880+00 to 930+00 again in May 2024. The example calls that stretch the Beaumont shoal.
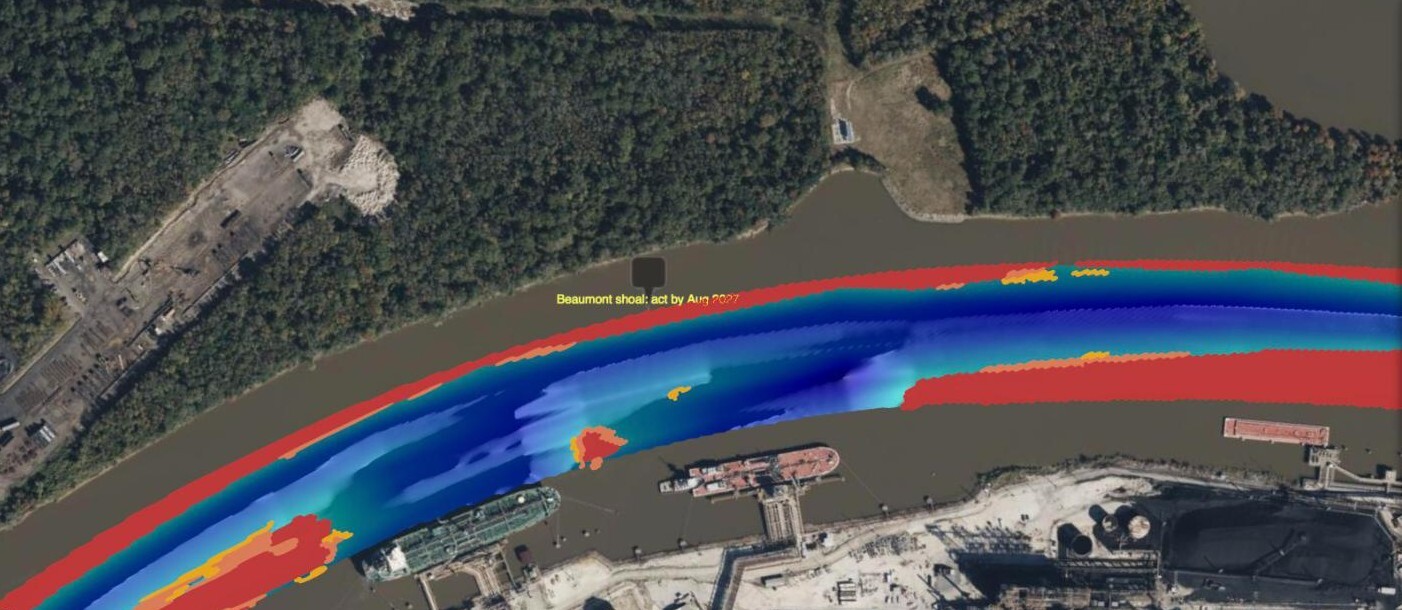
The September 2026 survey with the forecast's shapes: red where the bottom is above 40 ft now, orange where it will be by September 2027 and yellow by September 2028, counting the same 0.5 ft allowance as the volumes. The red along both edges is usual for this channel: 41 of USACE's 42 condition reports for these surveys show both outside quarters shallower than 40 ft. The object, "Beaumont shoal: act by Aug 2027", holds the shoal's numbers. Data: U.S. Army Corps of Engineers.
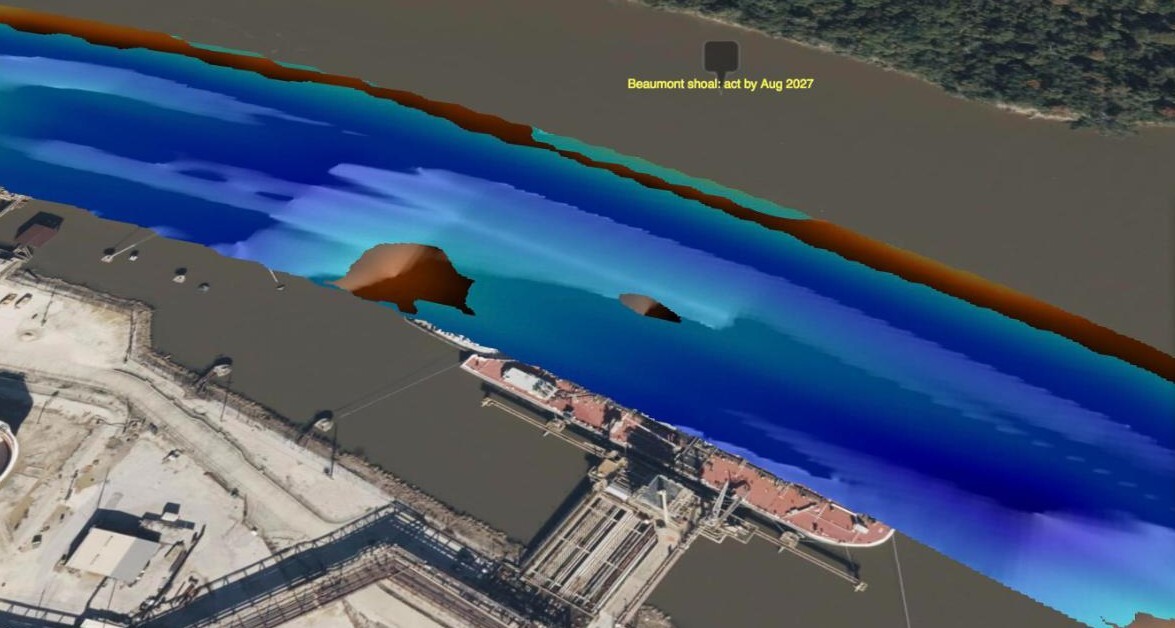
The same forecast in 3D, beside the tanker berths. The gold Grid is the material that will be above 40 ft by September 2028, at its forecast depth, so a tilted view shows it where it lies; lighter is shallower. Data: U.S. Army Corps of Engineers.
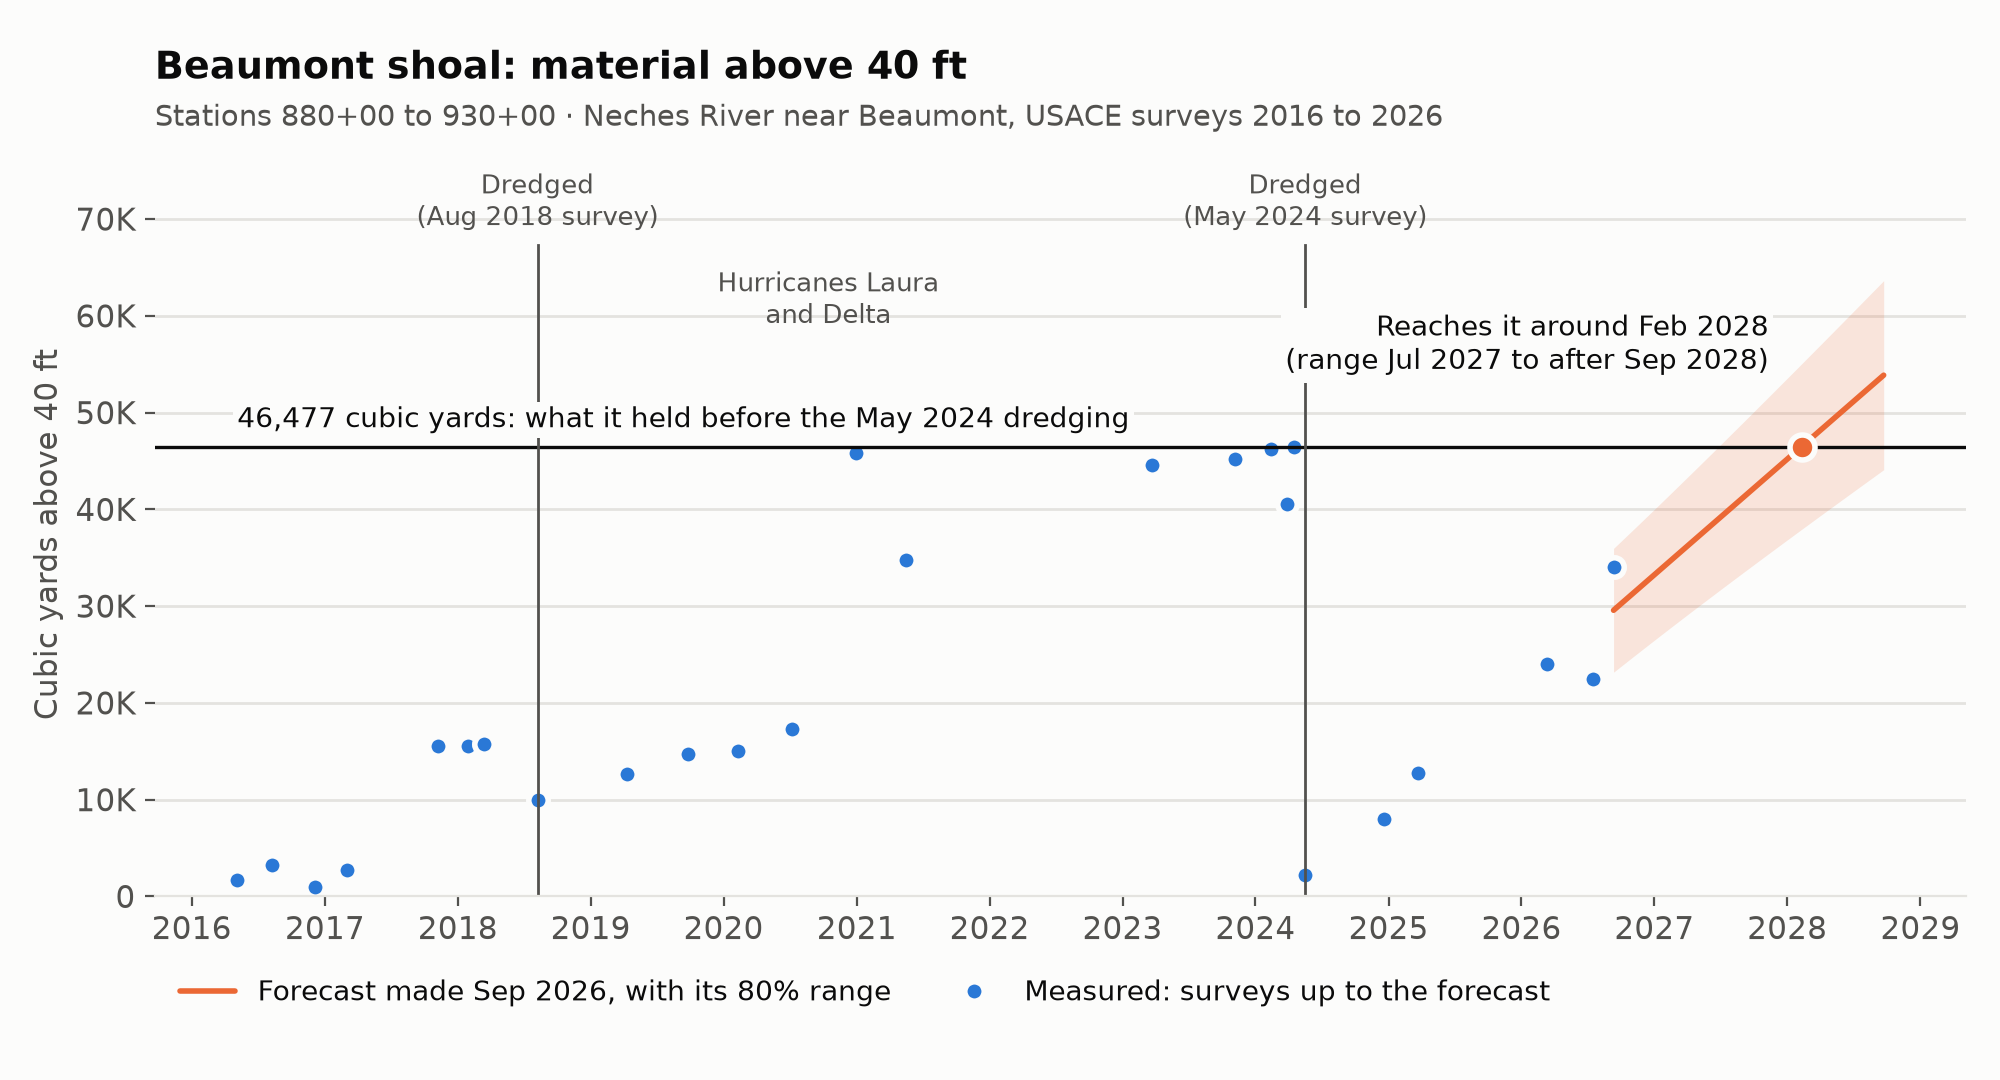
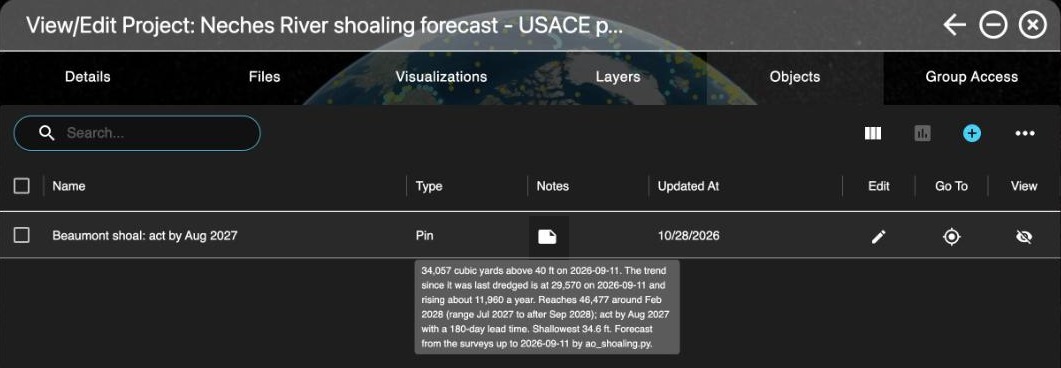
On September 11, 2026, the Beaumont shoal held 34,057 cubic yards above 40 ft. The forecast follows the trend line through all the surveys since the May 2024 dredging, which that day stood lower, at 29,570 cubic yards, rising about 11,960 cubic yards a year: the latest survey came in above the trend. Before that dredging, the shoal held 46,477 cubic yards. The trend reaches that again around February 2028, with an 80% range from July 2027 to after September 2028, so with six months to confirm, contract and dredge, act by August 2027, or by January 2027 to plan for the early end of the range.
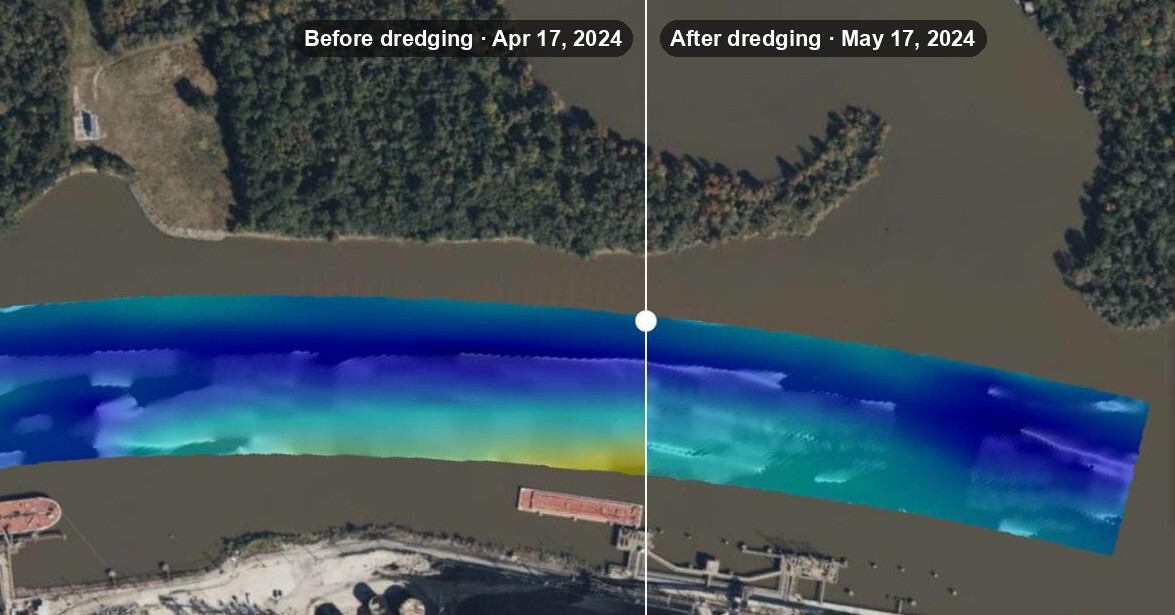
The Swipe Tool between the surveys of April 17, 2024 (left of the slider) and May 17, 2024 (right of it), both with the same Vertical Range: the shallow band along the south edge is gone after the dredging. Data: U.S. Army Corps of Engineers.
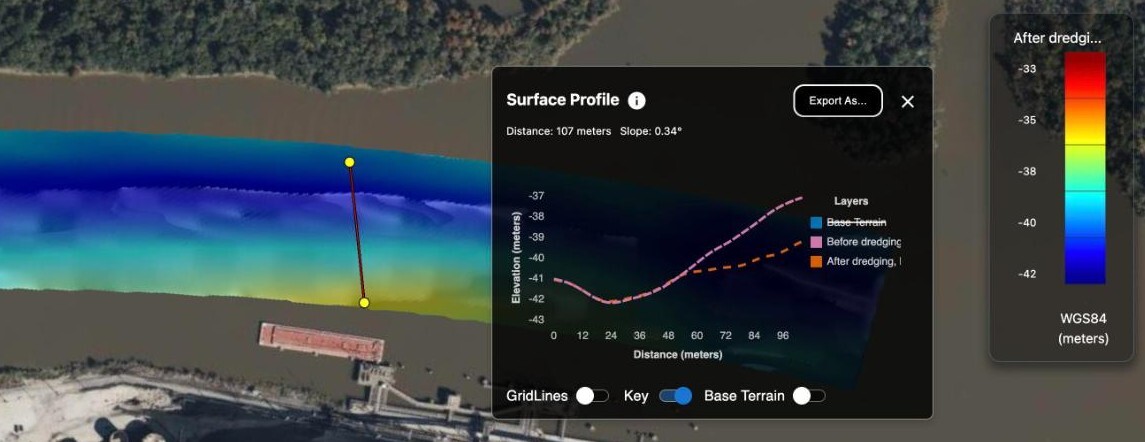
A Measure 3D Profile across the shoal, with Base Terrain off: the two surveys match on the north half, and on the south half dredging lowered the bottom by about 2 m (7 ft). The chart's heights are in meters on the WGS 84 ellipsoid: here, −38 m is about 34 ft below MLLW.
How good is the forecast
The backtest makes a forecast from every survey date for every 1,000 ft of channel, using only the surveys up to that date, and checks it against each survey 9 to 18 months later, until the next dredging.
| Forecasts | How many | Median error | Measured value inside the 80% range |
|---|---|---|---|
| Stretches holding more than 10,000 cubic yards | 64 | 13% (1,662 cubic yards) | 70% |
| The same stretches, assuming no change | 64 | 21% (2,532 cubic yards) | |
| All stretches | 785 | 740 cubic yards | 60% |
| All stretches, assuming no change | 785 | 737 cubic yards |
For the stretches that matter, the forecast's error is about a third smaller than assuming nothing changes (13% against 21%). Over all stretches, most of which hold little, it's no better. Its range catches the measured value less often than 80%, so plan with the range, not the single date, and confirm with a survey before you dredge.
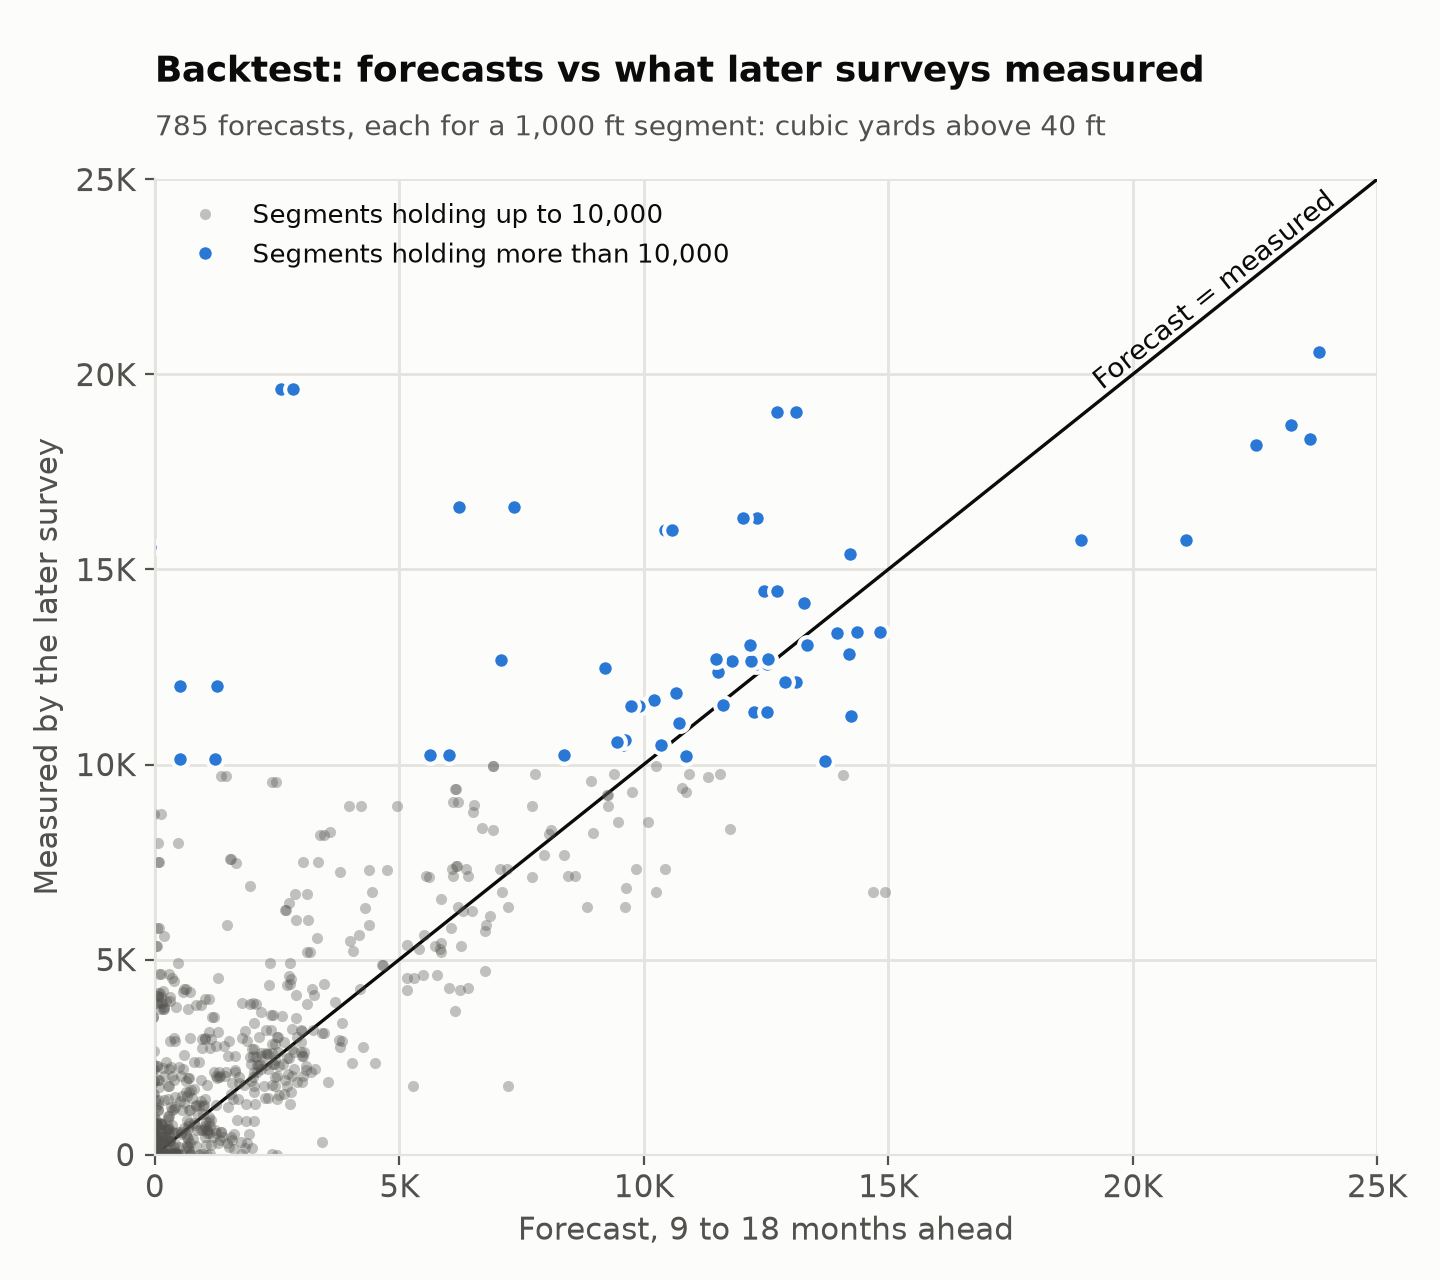
Each dot is one forecast. The dots far above the line are stretches that filled faster than any trend predicted: 16 of the 18 biggest misses are surveys made after Hurricane Harvey in 2017 or Hurricanes Laura and Delta in 2020.
The volumes match USACE's own: across the 42 surveys that hold more than 1,000 cubic yards above 40 ft, the script's volume is a median 96% of the planning quantity USACE publishes with each survey (87% to 102%).
Run it
Download ehydro_fetch.py and ao_shoaling.py. They need Python 3.10 or later and a few packages:
pip install requests numpy rasterio scipy pyproj matplotlib1. Get the surveys
ehydro_fetch.py downloads a channel's public condition surveys from USACE's eHydro service and grids them onto the same cells. To find a channel's id, list a district's channels, such as CESWG for Galveston. The list shows USACE's sheet name for each channel: this one is under SABINE.
python3 ehydro_fetch.py CESWG --list
python3 ehydro_fetch.py CESWG_NR_02_BTB --since 2016-01-01 --until 2026-09-30 --pick neches-example-surveys.txt
The example's 43 surveys are in neches-example-surveys.txt: every survey from 2016 through September 2026 except three that repeat others, two partial surveys from 2016 and a second copy from March 14, 2018. Without --pick, you get those too, and without --until, any newer surveys. Your numbers can differ from the article's in the last digits.
It writes a folder named for the channel: each survey as USACE publishes it, a grid of each survey's depths in feet, a surveys.csv that lists them, and the channel's outline and depths. It keeps condition surveys (types CS and PR) and the surveys before and after dredging (BD and AD). It skips combined surveys (XC), which repeat other surveys under one date.
2. Make the forecast
Add it to an AO project:
export AO_URL=https://ao.example.com
export AO_EMAIL=you@example.com
python3 ao_shoaling.py "Neches River" CESWG_NR_02_BTB --stations 505+00:950+16 --shoal "Beaumont shoal=880+00:930+00" --backtest
Run it as an Admin or a Professional. It asks for your AO password, then adds to the project:
- The forecast depths at the end of the forecast, the material that will be above the required depth by then, at its forecast depth and in gold, and the latest survey, as Grids on MLLW. Each cell's forecast is the median of the cells' own trends within 2 cells of it, so a few steep trends don't stick up. AO's MLLW depth (EPSG 5866) is in meters, so the script uploads copies in meters, on cells 4 times smaller and smoothed over about a cell so they look smooth up close, and AO shows them in your display units.
- Three shape files: where the bottom is above the required depth now (red), in 12 months (orange) and at the end of the forecast (yellow). They leave out pieces and holes of fewer than 10 cells, and round off the cells' corners.
- One object for each shoal, named with its act-by date and with its numbers in Notes, Category
Shoaling forecastand Sourceao_shoaling.py. New objects can start hidden on the map: on the project's Objects tab, turn them on in the View column.
On your computer, it also writes shoals.csv, segments.csv, backtest.csv and the charts. Without --shoal, each run of 1,000 ft segments that will each hold more than 10,000 cubic yards by the end of the forecast becomes a shoal.
With --no-upload, it only writes the files. With --as-of 2022-03-31, it forecasts from the surveys up to that date and draws the later surveys on the chart. On MCP-enabled AO, you can set AO_TOKEN to an API token instead of setting AO_EMAIL (see Ways to sign in in Getting started with the AO API).
With your own surveys: make a folder with a surveys.csv (columns survey, type, date and grid), the grids it names, as depths below one vertical datum (positive down) on the same cells, and a channel.tif with 1 on the channel's cells. Give the type AD to surveys made right after dredging, and set --vertical-epsg to your depths' vertical CRS.
Settings
| Setting | Default | What it does |
|---|---|---|
--required |
The channel's maintained depth (40 ft here) | The depth to keep, such as a ship's draft plus under-keel clearance |
--allowance |
0.5 | Counts every depth this much shallower, for the volumes and the shapes, as USACE's planning quantities do |
--trigger-volume |
What the shoal held before it was last dredged | The volume at which to act |
--lead-time |
180 days | Time to confirm with a survey, contract, mobilize and dredge |
--horizon |
24 months | How far ahead to forecast |
--stations |
Distance from the --start end |
The stations of the channel's two ends, such as 505+00:950+16, from the survey names |
--segment |
1,000 ft | Length of the stretches the backtest and the table use |
--dredge-volume |
3,000 | A drop of more than half that's also more than this counts as dredging, as do after-dredging (AD) surveys |
--min-surveys, --min-span |
3 surveys, 180 days | What a trend needs since the last dredging |
--confidence |
0.8 | The range's confidence |
--vertical-epsg |
5866 (MLLW depth) | The depths' vertical CRS for the grids in AO. MLLW works where NOAA's tidal grids reach, which is US waters; use your datum's code elsewhere, or 0 for a Custom Vertical Offset of 0 |
How it works
- Stations: each cell's distance along the channel, scaled to the stations you give.
- Volume: for every survey that covers at least 97% of a stretch, the material above the required depth: each cell's height above it, times its area.
- Dredging: a stretch was dredged at an after-dredging (AD) survey, or when its volume dropped by more than half. Its trend starts again there.
- Trend: a straight line through the volumes since the last dredging, with a range from the scatter around the line.
- When: the date the line reaches the trigger volume. Act by that date minus the lead time.
The trend and its range, from ao_shoaling.py:
class Trend:
    """A straight line through (year, volume) points, with a range for a new survey."""

    def __init__(self, x, y, confidence):
        self.n = len(x)
        fit = stats.linregress(x, y)
        self.slope, self.intercept = fit.slope, fit.intercept
        self.mean = x.mean()
        self.sxx = np.sum((x - self.mean) ** 2)
        self.scatter = np.sqrt(
            np.sum((y - self.intercept - self.slope * x) ** 2) / (self.n - 2)
        )
        self.z = stats.t.ppf((1 + confidence) / 2, self.n - 2)

    def at(self, x):
        x = np.asarray(x, float)
        center = self.intercept + self.slope * x
        half = (
            self.z
            * self.scatter
            * np.sqrt(1 + 1 / self.n + (x - self.mean) ** 2 / self.sxx)
        )
        return center, center - half, center + half
In AO
- Look straight down to see the shapes over a survey. AO draws shapes on the water's surface and a survey at its depth, so in a tilted view they're offset from each other. In a tilted view, show the gold Grid instead: it sits on the channel bottom, where the material will be.
- The legend shows heights on the WGS 84 ellipsoid, not depths below MLLW. Here, 20 to 50 ft below MLLW is about −110 to −140 ft.
- To compare surveys with the Swipe Tool, visualize them with the same Vertical Range, so a color means the same depth in each. Type the range in the legend's heights, lower value first: here, about −140 to −110 ft for 50 to 20 ft below MLLW.
- To share the picture, send a share link to the view, with the surveys, the shapes and the objects showing.
Good to know
- A straight line can't foresee storms, floods or dredging. Survey after a big event and run the forecast again.
- It's a trend from surveys, not a model of the river. It says how fast material has been coming back, not why.
- The volume counts material inside the channel's outline, above the required depth. A stretch dredged deeper than that shows no volume, and no trend, until the bottom rises past it.
- Check each survey's vertical datum on its plot sheet: the script doesn't convert datums. Of this channel's 8 surveys before 2016, 6 name mean low tide (MLT) in their file names and 2 name no datum.
ehydro_fetch.pyneeds internet access.ao_shoaling.pydoesn't, so with your own surveys it works on AO OnBoard and other networks without internet access.- On MCP-enabled AO (preview), an AI assistant that can run programs on your computer can run the forecast for you, as you. Give it what the run needs, for example "Run ao_shoaling.py again with the same --stations and --shoal, plus --lead-time 90 and --no-upload: when does the Beaumont shoal need dredging?" When it runs the script, the numbers come from the script and nothing is added to AO. If it answers without running it, ask it to. See Connect an AI assistant to AO.
- These are samples to adapt, not engineering advice. Confirm with a survey before you dredge.
What it adds up to
From ten years of public USACE surveys of one channel and AO as it is today, the example builds a dredging plan:
- Where: the shoals, mapped in AO now and for the next two years.
- How much: 34,057 cubic yards above 40 ft in the Beaumont shoal, from volumes that come to a median 96% of USACE's own (87% to 102%).
- When: back to its last dredging level around February 2028, so act by August 2027.
- How far to trust it: a backtest of 785 forecasts: on the busy stretches, about a third less error than assuming nothing changes.
- One shared record: the surveys, the forecast and each shoal's numbers in one AO project, ready to share.
With your own surveys, required depths and lead times, the same steps plan your channels.
Related: Run your own analysis on AO data · Compare two surveys with a script · Getting started with the AO API · Map tools · Objects