
AO stores, visualizes and shares your survey data. It doesn't run analysis models or detect targets itself. To spot and measure change between two surveys, start with the Swipe Tool and a profile. To measure it everywhere or automate it, run your own analysis: use your own software or models on the same data, then bring the results back into AO to review them on the map with everything else, and share them.
See what changed between two surveys
Upload and visualize the before and after surveys in the same project, as grids. Then:
- Show only the two surveys in the Layers window.
- See it: choose the Swipe Tool, pick the after survey in the box beside the search box, and drag the slider across the map to find where they differ.
- Measure it: with Base Terrain set to 3D, choose Measure 3D Profile and draw a line across that spot, inside the data. The Surface Profile window charts one line per survey. Turn on Key and click a survey in it to hide or show its line, and turn off Base Terrain so small differences stand out. The profile stays open while you swipe.
- Measure it everywhere, or automate it: make a difference grid, as below, in your own software or with the sample script.
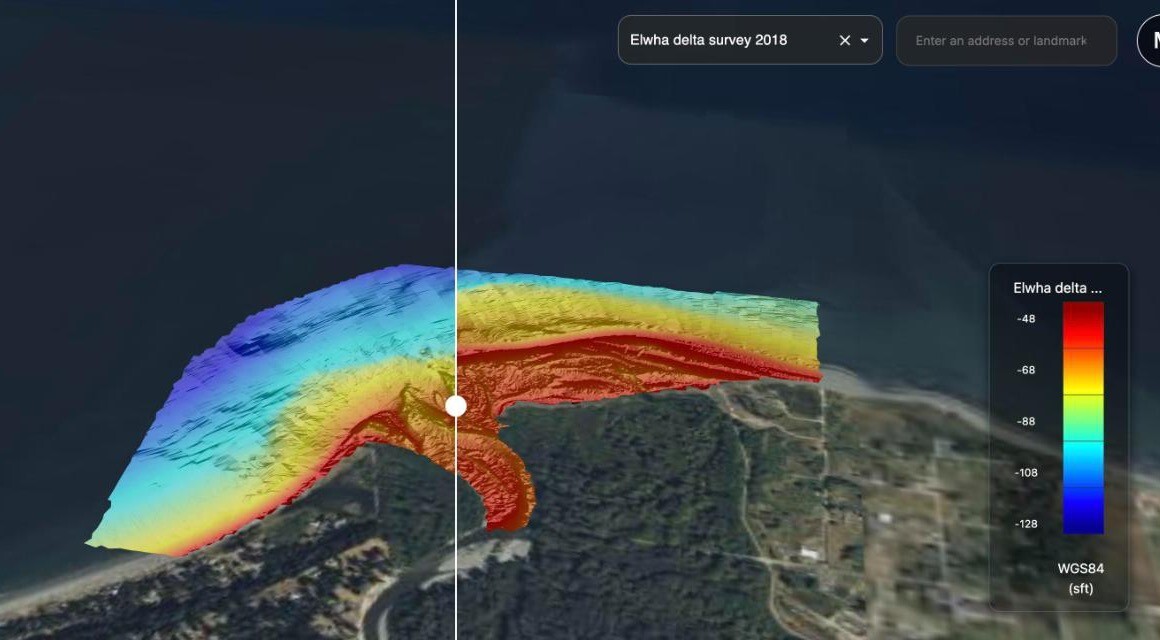
Two surveys of the Elwha River delta in Washington: September 2010, before the river's two dams were removed, left of the slider, and July 2018 right of it. The red along the shore in 2018 is new sediment. Data: U.S. Geological Survey.
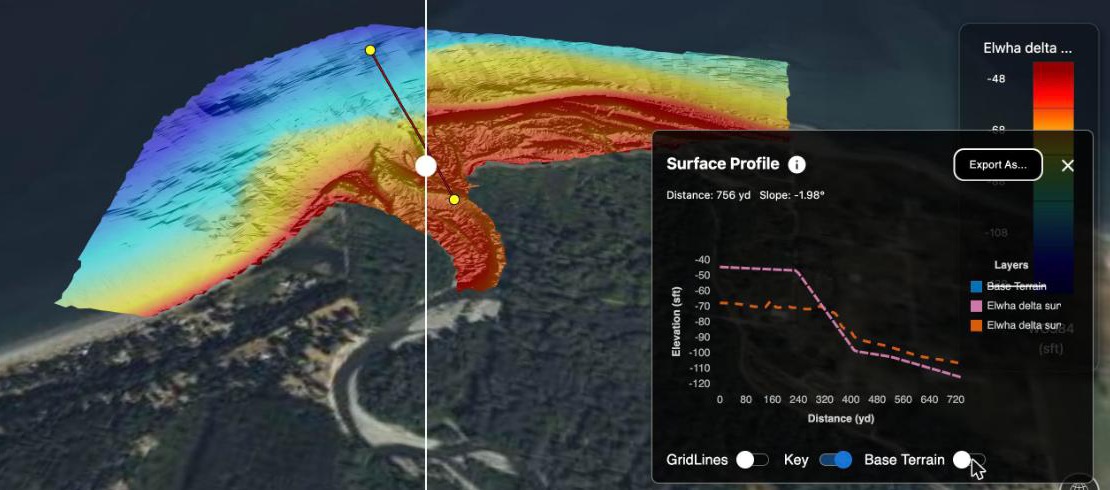
A profile across the river mouth, with the Swipe Tool still open and the profile's Base Terrain off. Near the mouth, the 2018 line is about 25 ft (8 m) above the 2010 line.
Measure the change everywhere
- Make a difference grid: the after survey minus the before survey, on the same cells. Both surveys need the same horizontal and vertical datum and the same corrections, such as sound velocity and tide, or the difference shows processing rather than real change: AO applies neither. Save it as a GeoTIFF with one band of 32-bit floating-point values (Float32), with NoData where either survey has no data. AO can't color 64-bit (Float64) files.
- Upload it to the project and visualize it as a Grid. In the visualize window, use the switch beside the vertical CRS to enter a Custom Vertical Offset, and set it to 0. Set Vertical Units to the grid's units, such as Meters: it starts at your display units. The legend, the cursor's elevation readout and profiles then show the change in meters. With a vertical datum instead, such as NAVD88, AO adds that datum's offset to every value.
- To chart the change along a line, draw a Measure 3D Profile line inside the data and turn off the profile's Base Terrain line. Where a line leaves the grid or crosses a gap in it, the grid's line drops to the base terrain.
- For a map picture of the change, also visualize the difference as Imagery (see To center the colors on zero, below).
- Mark what you find as objects, in AO or from your own tools through the API, with a Category and Notes.
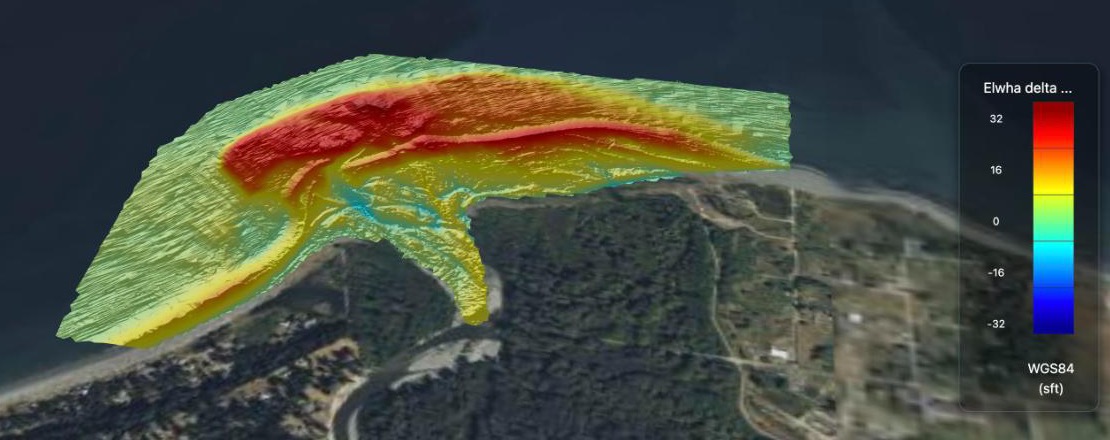
The 2018 survey minus the 2010 survey, made with the sample script's difference step and visualized as a Grid with a Custom Vertical Offset of 0 and a Vertical Range of −10 to 10 m: red is up to 10 m (32 ft) of new sediment, green is no change. Data: U.S. Geological Survey.
With the sample script
Compare two surveys with a script gives you a ready-made Python script that does steps 1, 2 and 5 for two grids in a project. You run it on your own computer, and you can change it to suit your data. It downloads both grids, makes the difference, adds it to the project as a Grid with a Custom Vertical Offset of 0, and, if you ask, adds an object for each area that changed by more than a depth you set:
python3 ao_change.py "Kaena Point" baseline.tif resurvey.tif --mark 0.5The objects it adds can start hidden on the map: on the project's Objects tab, turn them on with the eye icon in the View column.
For channels, Plan dredging from repeat surveys in AO takes the same approach further: from a series of surveys, it forecasts where and when a channel needs dredging, and how much material is involved.
Run other analysis on AO data
The same round trip works for any analysis, such as target detection or classification:
- Get the data to your tool. If the project is on a cloud mount, your tool can read the same files directly from your storage. Otherwise download them with the AO CLI, the files script or the AO API. On AO OnBoard systems with a processing workstation, run your software there: see AO OnBoard overview. The virtual machine image has no workstation, so use your own computers.
- Run your analysis in your own software, as you would on any other copy of the data.
- Bring the results back:
- A grid of values, such as a difference or a score: a Float32 GeoTIFF with one band.
- Shapes, such as outlines of detections: GeoJSON, shapefile or KML.
- Individual findings you want to track: objects.
POST /api/v1/markeradds one object per call, for Admins and Professionals. Send aname,type(PinorPolygon), the project'sorg_idandsurvey_uuid, andmarker_coordinates(POINT(lon lat), or a closedPOLYGON((lon lat, lon lat, ...))). Optionally add a Category (label), Notes (comments) andsource. See Getting started with the AO API.
- Review them in AO with the map tools and on the project's Objects tab, and send a share link to show others.
What AO shows of your results
| You bring back | AO shows | Keep in mind |
|---|---|---|
| A difference or score grid (Float32 GeoTIFF, one band) as a Grid | A 3D surface at its own values, with values in the legend, the cursor readout and profiles | Set a Custom Vertical Offset of 0, or a vertical datum's offset is added. With an offset of 0, a difference sits at height 0 on the WGS 84 ellipsoid, which can be tens of meters above or below sea level, not on the seafloor |
| The same file as Imagery | Draped on the map, colored from its lowest to its highest value (Gold, Greyscale or Jet) | Colors only: the legend has no values, and the cursor readout shows the terrain, not your values. Zero isn't centered, so no change shows as a middle color, such as yellow in Jet |
| A diverging color copy (8-bit, 3-band GeoTIFF) as Imagery | Your colors, centered on zero | Colors only |
| Shapes (GeoJSON, shapefile, KML) | The shapes, all in the visualization's Vector Color, with polygons filled | Attributes, such as a confidence score, aren't shown. The file in the project keeps them |
| Findings as objects (API) | Each one on the map and on the Objects tab, with its name, Category and Notes | One object per call. New objects can start hidden on the map: turn them on in the Objects tab's View column |
To center the colors on zero: color the difference with a diverging palette in your own software, such as blue for loss, white for no change and red for gain. Save that as an 8-bit, 3-band color GeoTIFF with NoData set to 0, and visualize it as Imagery. Keep the Float32 file as a Grid for values and profiles.
To see detections by confidence: split them into one file per confidence band, named for the band, such as changes_high_confidence, and give each its own Vector Color. Each file is its own layer in the Layers window. Or add them as objects, with the score in the Category or Notes.
Good to know
- Analyze the original files, not exports. Export GeoTIFF saves colors, not data values, and a profile exports as a picture.
- AO doesn't run your models. It holds the data before and after your analysis. The sample script runs on your computer, not in AO.
- It works without internet access, on AO OnBoard and on your own network, as long as your software runs there too.
- On MCP-enabled AO (preview), an AI assistant that can run programs on your computer can do the comparison for you, as you, if you give it write access. Ask, for example, "Compare these two surveys and mark where the depth changed by more than 0.5 m": it runs the sample script, which downloads both grids, uploads the difference and adds the objects. See Connect an AI assistant to AO.
Related: Compare two surveys with a script · Plan dredging from repeat surveys in AO · Map tools · Objects · Getting started with the AO API · Vertical and Horizontal Datum · Coming soon in AO