
This quick start takes you from your first sign-in to your own data on the map, measured and shared, in seven steps. Each step links to the article with the details.
To create projects, upload and visualize, you need the Professional or Admin role. With the User or Guest role, start at step 5 with a project someone has shared with you. To see your role, click your initial in the top right corner, choose My Account and open Profile. Using AO OnBoard? Start with AO OnBoard quick start.
1. Sign in for the first time
Open the email "Create Your Password For Terradepth Absolute Ocean" and choose Create Password. Enter a New Password and Confirm Password (at least 8 characters, with an uppercase letter, a lowercase letter and a number), then choose Reset. On the sign-in page, enter your Email and Password and choose Sign in with email, or choose your organization's sign-in button, such as Login with Microsoft.
The link lasts 24 hours. If it has expired, see Signing in and passwords.
2. Create a project
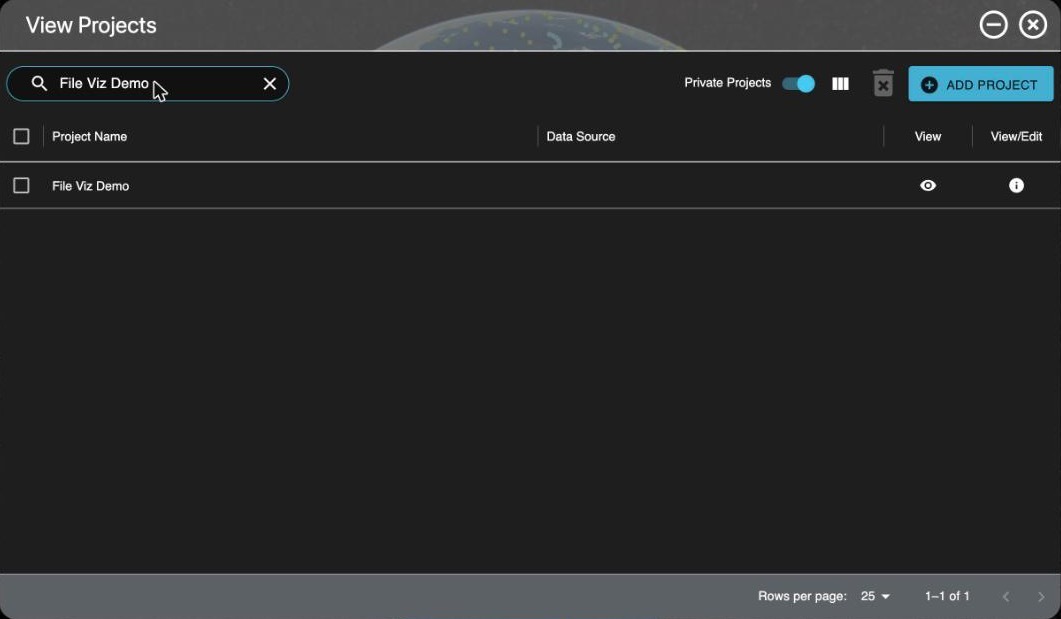
Open Projects at the bottom of the left toolbar and choose Add Project. Enter a Name, and set the Default Coordinate Reference System if you know it: AO uses it for files that don't store their own. Choose Save & Continue. AO says Project Has Been Created and opens the project's Group Access tab, which you can come back to in step 7.
More in Project Management & File Visualization.
3. Upload files
In the project, open the Files tab and choose Upload. Drag files or whole folders into the window, or use its browse buttons, then choose Upload. Keep the page open until each file shows Uploaded. To see a file on the map, it must be a type AO can visualize, such as GeoTIFF, BAG, LAS, LAZ or XYZ: see Supported file types and format requirements.
For large amounts of data, or a slow connection, see Moving Files In and Out of AO and Best practices for loading data to AO.
4. Visualize a file
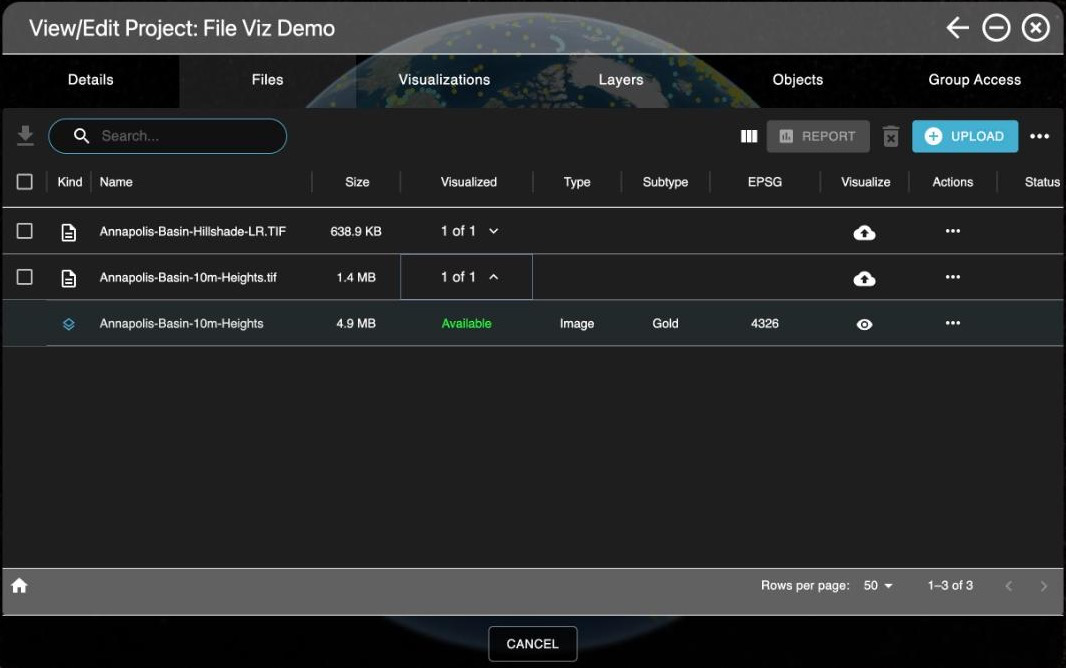
On the file's row, choose the cloud icon in the Visualize column, or Visualize on the row's ... menu. For a single-band GeoTIFF or a BAG, choose the Visualization Type: Grid for elevation or depth, Imagery for a picture. Check the coordinate systems (below), then choose Generate Visualization. AO says Visualization Process Started and opens the Visualizations tab.
The options for each kind of file are in File Visualization Table.
Coordinate system basics
- Main is the horizontal coordinate reference system (CRS), where the data is. Its label says where AO found it: FILE METADATA, PROJECT DEFAULT, USER SELECTED, or MISSING if you need to choose one.
- Vertical, when it's shown, is what heights or depths are measured from. Files rarely store it, so check the survey's documentation. If you don't know it, MSL height or MSL depth is usually a reasonable choice.
- To change either one, choose its
 pencil icon, type a name or EPSG code in Search CRS..., choose the entry with the right units (meters or feet) and direction (height or depth), then Select.
- The icon beside the EPSG code shows whether AO can transform it to its map; choose it for details. Generate Visualization stays unavailable while a CRS has no transform available.
See Vertical and Horizontal Datum.
5. See it on the map
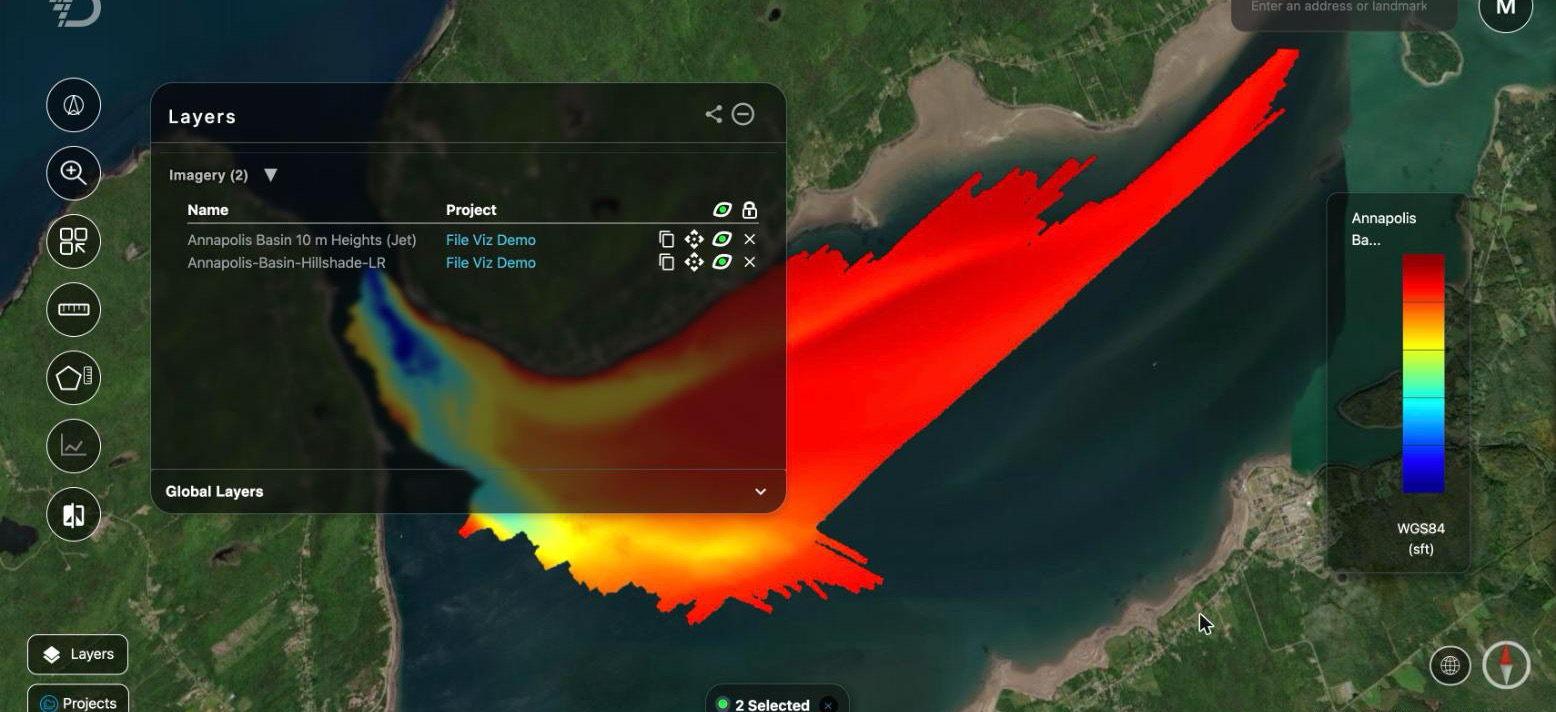
On the Visualizations tab, wait for the Status to show Available (the list refreshes every 30 seconds while any are in progress), then choose the  eye icon in the View column. AO flies to the layer and adds it to the Layers window. For a project someone shared with you, open Projects and choose the eye icon in the project's View column.
Open Layers at the bottom of the left toolbar to Show layer or Hide layer with its  eye icon, Zoom to layer, or Remove layer from the map. See Layers window. If a grid floats above or sinks below the terrain, check its vertical datum; if a point cloud is hidden under the terrain, you may have pressed 1: press it again, or switch Base Terrain to 2D (Grids and 3D terrain).
6. Measure and profile
On the left toolbar, choose Measure Distance or Measure Area, click to place points, and right-click to finish. Read a distance's total before you right-click: right-click clears a distance. For a cross-section, set Base Terrain to 3D in the Layers window's Global Layers, choose Measure 3D Profile, then click a start point and an end point: the Surface Profile window charts each grid the line crosses.
Units follow your settings in My Account and display settings. All the tools are in Map tools.
7. Share or download
- Give colleagues the project: on its Group Access tab, tick a group under Organization's Groups, move it to Assigned Groups with the arrow, and choose Save & Continue. To create a group, see User Management.
- Send what you see: in the Layers window, choose Copy share link and paste the link in a message. The colleague signs in to AO and needs access to the projects in the view.
- Download files (User role and above): on the Files tab, select the files and choose Download.
For layer links for GIS tools and other ways to share, see Sharing.
Next
- Mark targets and areas: Objects.
- Organize files into folders, or copy them to another project: Managing files in a project.
- Show charts, weather or your own map server alongside your data: External layers.
- Move around faster: HotKeys available in AO.
- Something not working: Troubleshooting and getting help.
Related: Project Management & File Visualization · Layers window · Troubleshooting and getting help